Gordon could impact pump prices in the short-term
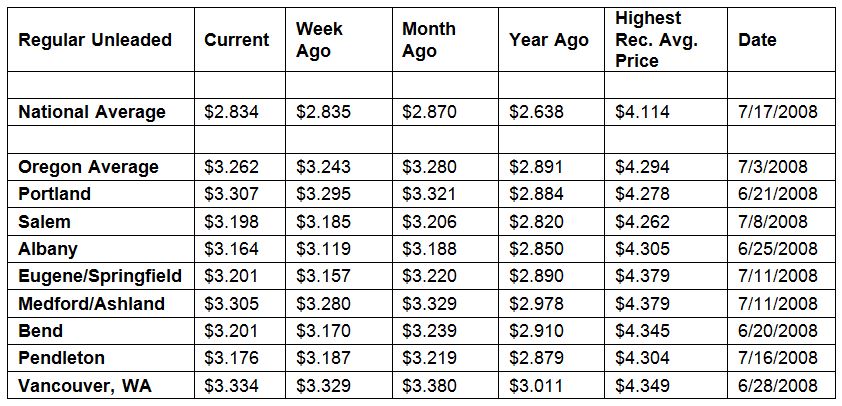
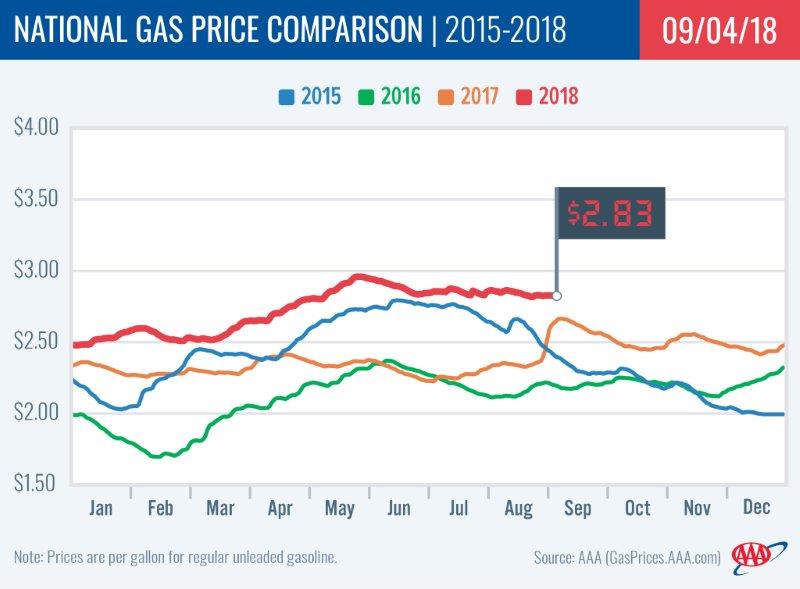
PORTLAND, Ore., – Demand for gasoline soared to its highest level ever on record but pump prices are fairly stable in most states, including Oregon. For the week, the national average for regular remains at $2.83 while Oregon’s average ticks up two cents to $3.26.
The latest report from the U.S. Energy Information Administration (EIA) shows gasoline demand at 9.899 million b/d for the week ending August 24. This is the highest level ever recorded and up from the previous week’s low of 9.45 million b/d.
The spike in demand is not expected to continue now that the summer driving season is coming to an end so pump prices should decline in the coming weeks. Gas prices tend to drop in the fall due to decreased demand as well as the switchover to the cheaper-to-produce winter blend gasoline in mid-September.
“AAA expects the national average to drop to $2.70 or less this fall, while the Oregon average should fall to $3.15 or less. However, a major storm is now taking aim at the U.S. Gulf coast and that could affect gas prices in the short-term,” says Marie Dodds, public affairs director for AAA Oregon/Idaho.
Tropical Storm Gordon is expected to strengthen into a hurricane before making landfall. Nearly half (45 percent) of the U.S. refinery capacity is in the Gulf Coast. Some facilities have already been evacuated as a precaution. Any lasting outages can cause prices to climb.
Oregon is one of 25 states where prices have increased week-over-week. Florida and Missouri have the largest increases (+6 cents). Ohio has the largest weekly decrease (-9.5 cents). This week 10 states have averages at or above $3 a gallon, same as a week ago.
Oregon is one of 42 states and the District of Columbia where prices are lower than one month ago. The national average is four cents less and the Oregon average is two cents less than a month ago. Oregon has the 40th-largest monthly decrease in the country. Indiana (-16 cents) has the largest monthly decrease, while Idaho (+10 cents) has the largest monthly increase.
The West Coast continues to have the most expensive gas prices in the nation. Hawaii tops the list for the 13th week in a row with California, Washington, Alaska, Oregon and Idaho rounding out the top six. Oregon rises to fifth after one week at sixth.
| Rank | Region | Price on 9/4/18 | |
| 1 | Hawaii | $3.78 | |
| 2 | California | $3.62 | |
| 3 | Washington | $3.38 | |
| 4 | Alaska | $3.31 | |
| 5 | Oregon | $3.26 | |
| 6 | Idaho | $3.25 | |
| 7 | Nevada | $3.19 | |
| 8 | Utah | $3.18 | |
| 9 | Pennsylvania | $3.05 | |
| 10 | Connecticut | $3.04 |
Prices in the region are mostly flat compared to last week, except for a two-cent jump in both California and Oregon.
Last week’s, Energy Information Administration report showed West Coast gasoline supplies dropped by 1.2million bbl, their largest one-week draw in five months. The region’s supplies now sit at 28.9 million bbl, which is still 2.7 million bbl higher than the same week last year.
The nation’s cheapest markets are Alabama ($2.53) and South Carolina ($2.53). For the 57th week in a row, no states have an average below $2.
Drivers in all 50 states and the District of Columbia are paying more than a year ago to fill up. The national average is 20 cents more and the Oregon average is 37 cents more than a year ago. This is the 11th-largest yearly increase in the country. Hawaii (+68 cents) has the greatest year-over-year increase; Utah (+57 cents) is second; California (+51 cents) is third; Arizona (+51 cents) is fourth; and Idaho (+47 cents) is fifth.
Oil Market Dynamics
Crude oil prices are climbing this week as the markets anticipate potential supply disruptions as a major storm is forecast to hit the U.S. Gulf Coast. Gordon is currently a tropical storm but is expected to strengthen to a hurricane. Some oil platforms are already being evacuated. About 17 percent of U.S. crude oil production occurs in the Gulf of Mexico.
Oil prices reflected modest gains last week, following the release of EIA’s report, which showed U.S. crude inventories fell nearly 2.6 million bbl. The U.S. also saw gasoline production increase last week, averaging 10.2 million barrels per day and refinery capacity sitting at 93.6 percent. Another sign of increased U.S. production came with the gain of two oil rigs bringing the U.S. total to 862 according to Baker Hughes.
International factors are also impacting global supply and demand for crude oil as Iranian oil exports drop as a result of sanctions. The market may react to tightened supply and pressure prices higher as a result of the next round of U.S. economic sanctions against Iran that are expected in November.
Market watchers will keep a close eye on the impacts of additional Iran sanctions and the storm in the Gulf of Mexico. Both factors could affect prices at the pump moving forward.
At the close of Friday’s formal trading session on the NYMEX, WTI decreased 45 cents to settle at $69.80. U.S. markets were closed Monday in observance of Labor Day. Today crude is trading around $70, compared to $69 a week ago. Crude prices are up about two percent in the last month and are about $23 more per barrel than a year ago.
Drivers can find current gas prices along their route with the free AAA Mobile app for iPhone, iPad and Android. The app can also be used to map a route, find discounts, book a hotel and access AAA roadside assistance. Learn more at AAA.com/mobile.
Diesel
For the week, the national average adds two cents to $3.17 a gallon. Oregon’s average ticks up a penny to $3.39. A year ago the national average for diesel was $2.66 and the Oregon average was $2.86.
Find current fuel prices at GasPrices.AAA.com.
AAA news releases, high resolution images, broadcast-quality video, fact sheets and podcasts are available on the AAA NewsRoom at NewsRoom.AAA.com.