Oregon Average at Highest Price since August 2015
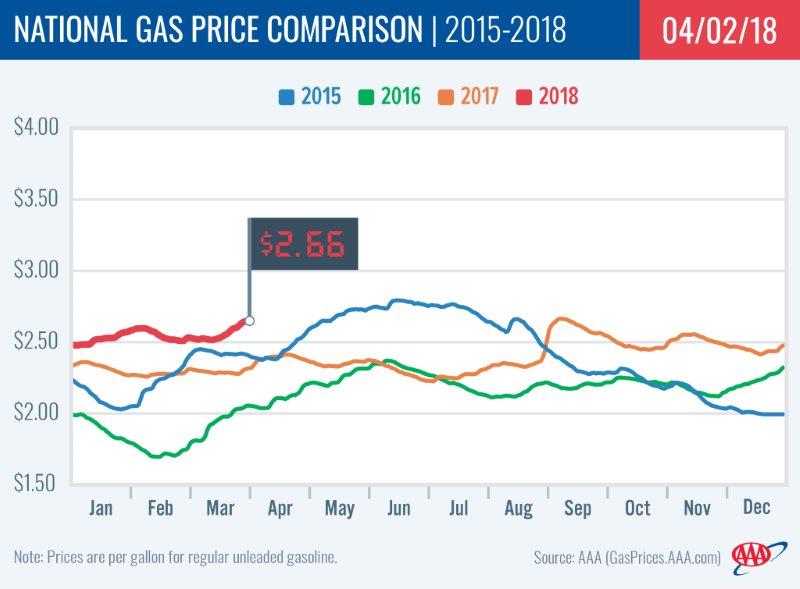
PORTLAND, Ore., – Gas prices continue to climb across the country as the market continues to purge winter-blend gasoline to make room for summer storage. For the week, the national average for regular jumps four cents to $2.66 a gallon while the Oregon average adds three cents to $3.09. The national average is at its highest price since last September following Hurricane Harvey. The Oregon average is at its highest price since August 2015. It remained above $3 a gallon that year from May 8 through August 16.
“Robust demand for gasoline and preparation for summer gasoline are factors that will continue to drive higher pump prices into early spring,” says Marie Dodds, public affairs director for AAA Oregon/Idaho. Many refineries conduct maintenance before making the switch to summer-blend fuel. This creates a temporary drop in supplies that puts additional upward pressure on prices. Summer-blend fuel is a formulation required in many urban areas during the spring and summer months to reduce air pollution.
Demand for gasoline has been very strong for March. The latest report from U.S. Energy Information Administration (EIA) shows that although demand fell to 9.2 million b/d—the lowest point for March 2018—this is still very robust for this time of year and is similar to demand normally seen during the summer months.
Oregon is one of 47 states and the District of Columbia where gas prices are higher week-over-week. One state, Utah (+13 cents), saw another double-digit increase this week. Oregon’s weekly increase is the 27th largest in the country at three cents. The only states with decreases for the week are Nebraska, North Dakota and Minnesota and all of these declines are just one cent or less.
Oregon is one of 47 states and the District of Columbia where prices are higher now than a month ago. The national average is 12 cents more and the Oregon average is 19 cents more than a month ago. This is the seventh-largest monthly increase in the country. The largest is in Utah (+27 cents). The largest monthly decrease is in North Dakota (-3 cents).
The West Coast still has the most expensive gas prices in the nation with six of the top ten states in this region. Hawaii tops the list, followed by California, Alaska, Washington, Oregon and Nevada. Oregon is fifth most expensive for the ninth week in a row. All West Coast states saw pump prices rise this week, with Nevada seeing the largest increase of eight cents and Hawaii the smallest at two-tenths of a cent.
| Rank | Region | Price on 4/3/18 | |
| 1 | Hawaii | $3.51 | |
| 2 | California | $3.51 | |
| 3 | Washington | $3.18 | |
| 4 | Alaska | $3.14 | |
| 5 | Oregon | $3.09 | |
| 6 | Nevada | $3.02 | |
| 7 | Pennsylvania | $2.87 | |
| 8 | District of Columbia | $2.82 | |
| 9 | Idaho | $2.82 | |
| 10 | New York | $2.77 |
Total gasoline production on the West Coast for last week is 1.59 million b/d, which is nearly 60,000 b/d less than the rate last year at this time. According to the EIA’s latest weekly report, total gasoline inventories in the region declined by 36,000 b/d last week to sit at 32.7 million bbl.. However, inventories may decline further with this week’s scheduled planned maintenance at the Phillips 66 Los Angeles Refinery, which can produce up to 147,000 b/d of gasoline.
The nation’s cheapest markets are Arkansas ($2.39) and Missouri ($2.40). For the 35th week in a row, no states have an average below $2.
Drivers in all 50 states and the District of Columbia are paying are paying more than a year ago to fill up. The national average is 33 cents more and the Oregon average is 36 cents more than a year ago. This is the eighth-largest yearly increase in the country. California has the greatest year-over-year increase of 53 cents; Hawaii is second at 45 cents, and South Carolina is third at 39 cents.
Oil Market Dynamics
Crude oil prices are lower this week. West Texas Intermediate climbed to near $65 per barrel last Thursday, after the Baker Hughes active rig count report showed that the U.S. dropped seven active rigs last week, bringing the total to 797. Price gains were tempered by EIA’s weekly report showing that total crude oil inventories grew by 1.5 million bbl last week. Moreover, domestic crude hit another top record for weekly production at 10.4 million b/d. If this week’s EIA report shows another inventory build, driven by record-setting oil production, prices may move lower as it may signal that global crude supplies may be on the rise again.
The NYMEX was closed on Friday due to the holiday. On Thursday, WTI increased 56 cents to settle at $64.94. At the close of Monday’s formal trading session on the NYMEX, WTI lost $1.93 to settle at $63.01. Today crude is trading around $63, compared to $65 a week ago. Crude prices are up about one percent in the last month and are about $12 more per barrel than a year ago.
Drivers can find current gas prices along their route with the free AAA Mobile app for iPhone, iPad and Android. The app can also be used to map a route, find discounts, book a hotel and access AAA roadside assistance. Learn more at AAA.com/mobile.
Diesel
For the week, the national average adds two cents to $2.97 a gallon. Oregon’s average jumps four cents to $3.17. A year ago the national average for diesel was $2.51 and the Oregon average was $2.67.
Find current fuel prices at GasPrices.AAA.com.
AAA news releases, high resolution images, broadcast-quality video, fact sheets and podcasts are available on the AAA NewsRoom at NewsRoom.AAA.com.