Oregon Average Remains at Highest Price since August 2015
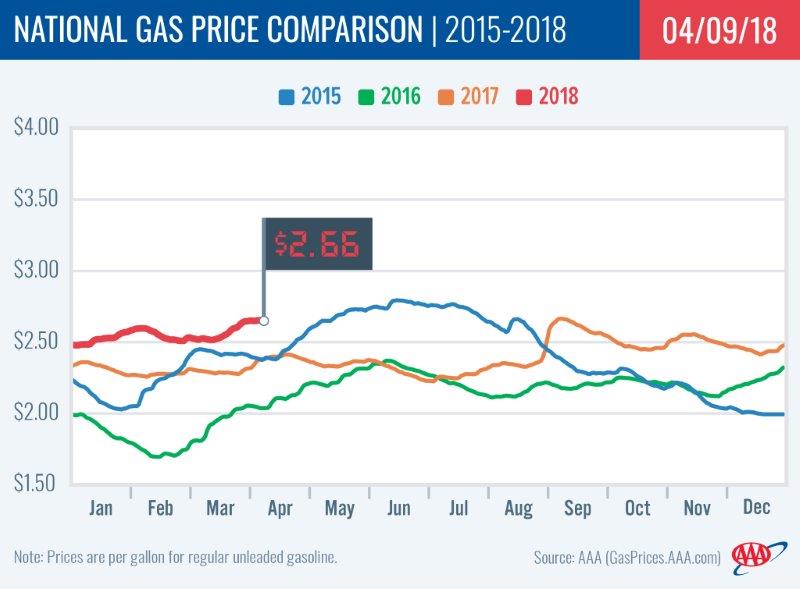
PORTLAND, Ore., – The national and Oregon averages are fairly steady this week but it’s a bumpy ride in other parts of the country as some states are seeing gas prices climb by double digits while others are enjoying declines as much as a dime. For the week, the national average for regular remains at $2.66 a gallon while the Oregon average adds a penny to $3.11. The national average is a few tenths of a cent less than its 2018 high; the Oregon average is at its highest price for the year so far.
The national average is at its highest price since last September when it climbed to $2.67 following Hurricane Harvey. The Oregon average is at its highest price since August 2015. It remained above $3 a gallon that year from May 8 through August 16.
AAA projects gas prices will continue to rise this spring but the weekly increases should become smaller. “The driving factors continue to be refinery maintenance season and the switchover to summer-blend fuel, robust demand for gasoline in the U.S. and around the globe, and higher crude oil prices compared to last year,” says Marie Dodds, public affairs director for AAA Oregon/Idaho.
Gas prices have edged higher this week following the U.S. Energy Information Administration’s (EIA) latest weekly report that showed gasoline inventories dropped by 1.1 million bbl. Demand for gasoline remains robust at 9.2 million b/d and is more in line with demand levels at this time last year.
Oregon is one of 22 states and the District of Columbia where gas prices are higher week-over-week. One state, Utah (+15 cents) saw another double-digit increase this week. Oregon’s weekly increase is the 23rd largest in the country at one cent. Michigan has the biggest decline of the week at 10 cents. Prices are flat in New Jersey.
Oregon is one of 47 states and the District of Columbia where prices are higher now than a month ago. The national average is 13 cents more and the Oregon average is 19 cents more than a month ago. This is the eighth-largest monthly increase in the country. The largest is in Utah (+45 cents). The largest monthly decrease is in North Dakota (-1 cent).
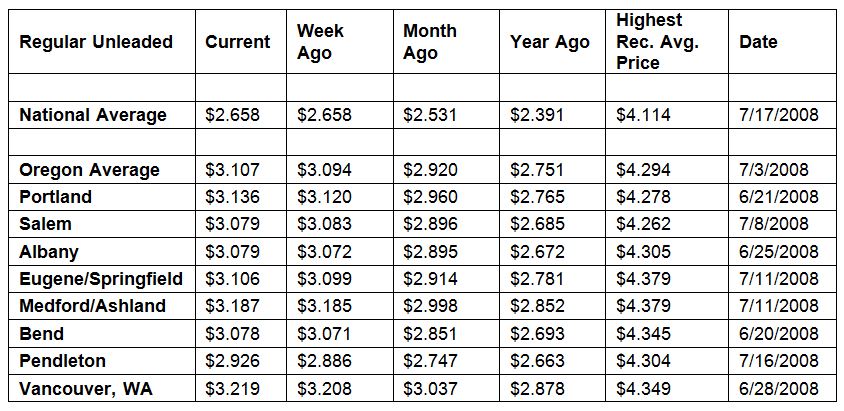
The West Coast still has the most expensive gas prices in the nation with six of the top ten states in this region. Hawaii tops the list, followed by California, Washington, Alaska, Oregon and Nevada. These are the only six states with averages at or above $3 a gallon. Oregon is fifth most expensive for the 10th week in a row.
| Rank | Region | Price on 4/10/18 | |
| 1 | Hawaii | $3.54 | |
| 2 | California | $3.52 | |
| 3 | Washington | $3.19 | |
| 4 | Alaska | $3.18 | |
| 5 | Oregon | $3.11 | |
| 6 | Nevada | $3.07 | |
| 7 | Idaho | $2.90 | |
| 8 | Pennsylvania | $2.87 | |
| 9 | Utah | $2.87 | |
| 10 | District of Columbia | $2.83 |
The EIA reports that gasoline stocks in this region decreased by 600,000 bbl for the week ending on March 30 – the second consecutive weekly decline in stocks. However, when compared to this time last year, they were approximately 2.5 million bbl higher.
The nation’s cheapest markets are Missouri ($2.38) and Arkansas ($2.38). For the 36th week in a row, no states have an average below $2.
Drivers in all 50 states and the District of Columbia are paying are paying more than a year ago to fill up. The national average is 27 cents more and the Oregon average is 36 cents more than a year ago. This is the seventh-largest yearly increase in the country. California has the greatest year-over-year increase of 54 cents; Hawaii is second at 48 cents, and Utah is third at 48 cents.
Oil Market Dynamics
Crude oil prices are rebounding this week after sliding last week amid fears of a trade war between the U.S. and China, as both countries issued threatened to increase tariffs on key goods produced in each country. This followed EIA reporting that crude exports hit a record high of 15.2 million bbl for the week ending on March 30. The last record high occurred in October 2017. Another record high for domestic crude production of 10.5 million b/d last week contributed to the U.S. shipping more oil to other countries.
Baker Hughes, Inc. reported that the U.S. gained 11 active oil rigs last week, raising the total number to 808. Increased U.S. crude output will likely put renewed focus on global crude supplies, as OPEC’s production reduction agreement with non-OPEC producers, including Russia, remains in effect. In fact, last week Russia’s Energy Minister Alexander Novak said that Moscow is considering cooperating with OPEC to curb global oil supplies indefinitely after the agreement expires at the end of the year. Since the agreement has been in place, OPEC and its partners have worked to reduce their combined output by 1.8 million b/d.
At the close of Friday’s formal trading session on the NYMEX, WTI decreased $1.48 to settle at $62.06. At the close of Monday’s formal trading session on the NYMEX, WTI gained $1.36 to settle at $63.42. Today crude is trading around $65, compared to $63 a week ago. Crude prices are up about six percent in the last month and are about $11 more per barrel than a year ago.
Drivers can find current gas prices along their route with the free AAA Mobile app for iPhone, iPad and Android. The app can also be used to map a route, find discounts, book a hotel and access AAA roadside assistance. Learn more at AAA.com/mobile.
Diesel
For the week, the national average holds steady at $2.97 a gallon. Oregon’s average adds two four cents to $3.19. A year ago the national average for diesel was $2.52 and the Oregon average was $2.68.
Find current fuel prices at GasPrices.AAA.com.
AAA news releases, high resolution images, broadcast-quality video, fact sheets and podcasts are available on the AAA NewsRoom at NewsRoom.AAA.com.