Gasoline Demand at Record Highs for April as Pump Prices Continue to Rise
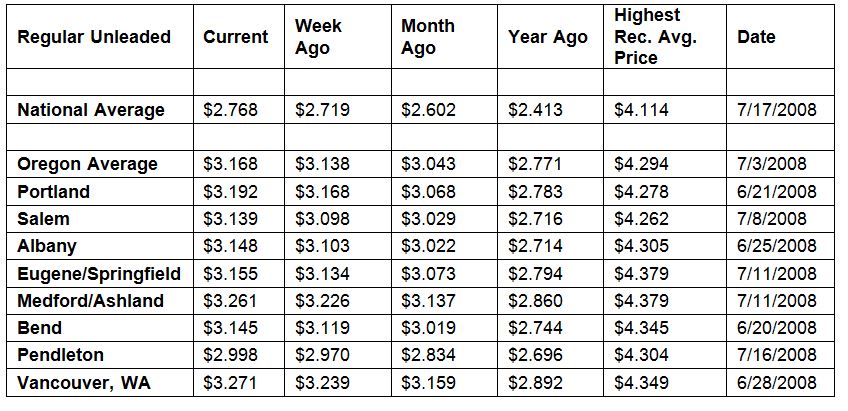
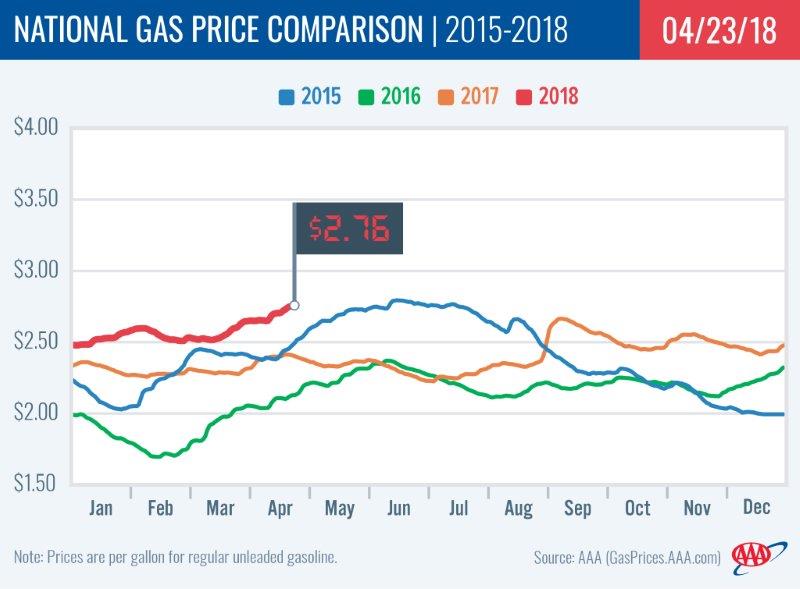
PORTLAND, Ore., – Demand for gasoline in the U.S. is surging to record highs, causing retail pump prices to climb. All 50 states are reporting weekly increases, with three states seeing double-digit jumps. For the week, the national average for regular jumps a nickel to $2.77 a gallon while the Oregon average adds three cents to $3.17.
The U.S. Energy Information Administration’s (EIA) latest data registers consumer gasoline demand at 9.857 million b/d. That is the highest level ever on record for the month of April and exceeds typical summer demand measurements. “Many consumers are shocked to see such high prices when they fill up their vehicles,” says Marie Dodds, public affairs director for AAA Oregon/Idaho. More than 13 percent of stations across the U.S. are selling gasoline for $3 or more.
All 50 states and the District of Columbia report week-over-week increases. The largest jumps are in Rhode Island (+12 cents), Connecticut (+11 cents) and New Jersey (+10 cents). Oregon has one of the smallest weekly increases of 3 cents, which is the 41st largest in the country.
All 50 states and the District of Columbia also have higher prices than one month ago. The national average is 17 cents more and the Oregon average is 13 cents more than a month ago. This is the 39th largest monthly increase in the country. Utah (+50 cents) and Idaho (+34 cents) have the largest monthly gains.
The West Coast still has the most expensive gas prices in the nation with six of the top ten states in this region. Hawaii tops the list, followed by California, Washington, Alaska, Nevada and Oregon. Oregon is sixth most expensive for the second week in a row. For the second week in a row, the same seven states have averages at or above $3 a gallon.
The EIA’s latest report registers total gasoline inventories in the West Coast region down by 1 million bbl to 30.4 million bbl. This draw was the highest one-week decline in five weeks. Still, West Coast gas stocks now sit 400,000 bbl higher than their level this time last year.
The nation’s cheapest markets are Missouri ($2.46) and Oklahoma ($2.47). For the 38th week in a row, no states have an average below $2.
Drivers in all 50 states and the District of Columbia are paying are paying more than a year ago to fill up. The national average is 36 cents more and the Oregon average is 40 cents more than a year ago. This is the ninth-largest yearly increase in the country. California has the greatest year-over-year increase of 58 cents; Utah is second at 55 cents; Hawaii is third at 51 cents; and Idaho is fourth at 50 cents.
Oil Market Dynamics
Crude oil prices are at their highest levels since December 2014. The market saw increased volatility on Friday morning due to President Trump’s tweet that criticized OPEC’s efforts to restrict global crude supply and raise the price per barrel, but later in the day, crude prices rebounded to the highs they experienced earlier in the week. The jump in price per barrel occurred after Wednesday’s EIA weekly report revealed that crude inventories across the U.S. dropped by a combined 1.1 million bbl. They now sit at 427.6 million bbl – nearly 105 million bbl lower than their level in mid-April 2017. If EIA’s report this week reveals another inventory draw, crude prices are likely to continue climbing.
The year-over-year decline in oil inventories is a result of OPEC’s agreement with large non-OPEC producers to reduce crude production by 1.8 million b/d which was put into place inJanuary 2017. The agreement is supposed to remain in effect until the end of 2018. However, last week Russian Energy Minister Alexander Novak said that producers in the agreement may begin easing output curbs sooner because the agreement has cleared out the glut of crude that the producers aimed to reduce. Saudi Arabia, a leading member of the cartel, is likely to push back on any efforts to end the production reduction agreement prior to the end of the year because WTI prices could reach $80-$100 by that time. Representatives from both countries are likely to discuss the matter at OPEC’s upcoming meeting in Vienna, Austria on June 20 and 21.
In related news, Baker Hughes reported that the U.S. gained five active oil rigs last week, bringing the total to 820. The total is up 132 rigs when compared to the rig count at this time last year.
At the close of Friday’s formal trading session on the NYMEX, West Texas Intermediate increased nine cents to settle at $68.38, which is the second highest close for WTI since Dec. 1, 2014. At the close of Monday’s formal trading session on the NYMEX, WTI added 24 cents to settle at $68.64. Today crude is trading around $69, compared to $66 a week ago. Crude prices are up about five percent in the last month and are about $19 more per barrel than a year ago.
Drivers can find current gas prices along their route with the free AAA Mobile app for iPhone, iPad and Android. The app can also be used to map a route, find discounts, book a hotel and access AAA roadside assistance. Learn more at AAA.com/mobile.
Diesel
For the week, the national average gains three cents to $3.04 a gallon. Oregon’s average adds four cents to $3.29. A year ago the national average for diesel was $2.54 and the Oregon average was $2.70.
Find current fuel prices at GasPrices.AAA.com.
AAA news releases, high resolution images, broadcast-quality video, fact sheets and podcasts are available on the AAA NewsRoom at NewsRoom.AAA.com.