Oregon Average Tops $3 a Gallon for First Time in Three Years
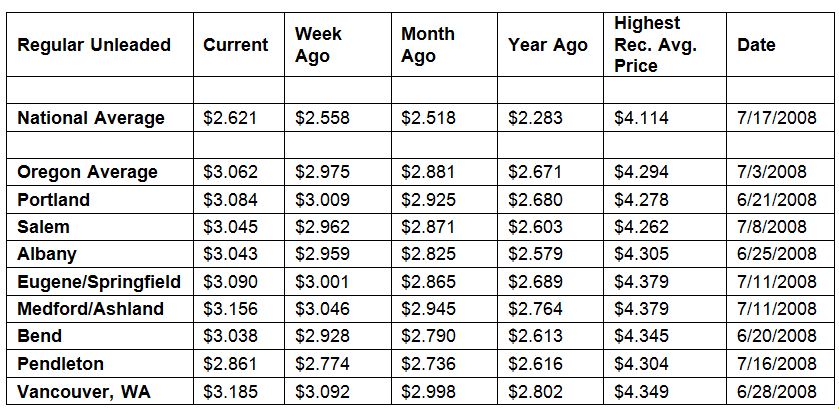
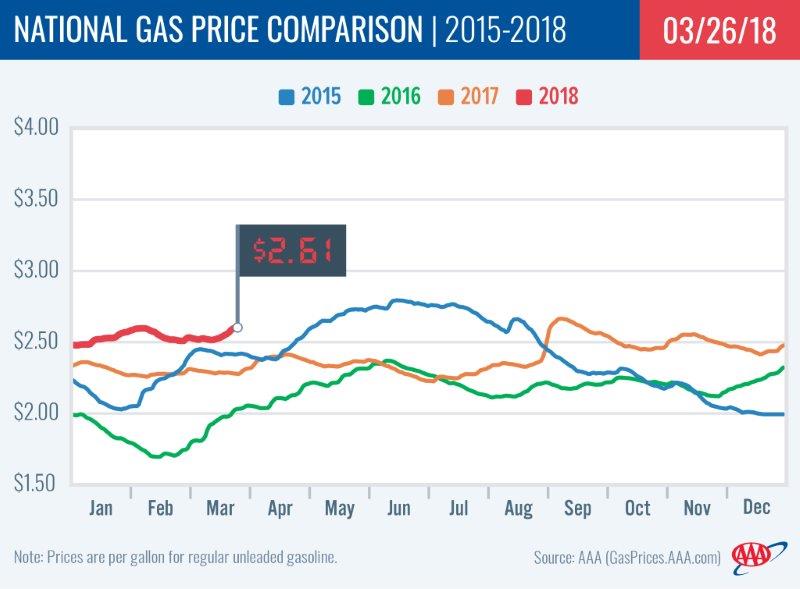
PORTLAND, Ore., – With the arrival of spring, gas prices are spiking across the country with some states seeing double-digit increases for the week. The national average for regular jumps six cents to $2.62 a gallon while the Oregon average spikes nine cents to $3.06. The Oregon average climbed above $3 per gallon on March 22 for the first time since May 8 through Aug 16, 2015, and is one of five states with an average at or above $3. The national average is at its highest price since September 18, 2017, in the wake of Hurricane Harvey.
“We’re seeing refineries across the country starting to purge winter-blend gasoline to make room for summer-blend, and many refineries go off line for maintenance. This creates a temporary crimp in supplies, one of several factors putting upward pressure on pump prices,” says Marie Dodds, public affairs director for AAA Oregon/Idaho. “AAA projects gas prices could climb another 20 to 40 cents before leveling off in the coming weeks.”
Summer-blend fuel is a formulation required in many urban areas during the spring and summer months to reduce air pollution. The difference between summer- and winter-blend gasoline involves the Reid Vapor Pressure (RVP) of the fuel. RVP is a measure of how easily the fuel evaporates at a given temperature. The more volatile a gasoline (higher RVP), the easier it evaporates. Winter-blend fuel has a higher RVP because the fuel must be able to evaporate at low temperatures for the engine to operate properly, especially when the engine is cold. Summer-blend gasoline has a lower RVP to prevent excessive evaporation when outside temperatures rise. Reducing the volatility of summer gas decreases emissions that can contribute to unhealthy ozone and smog levels.
Other market forces sending gas prices higher include very robust demand for gasoline in the U.S., an increase in global demand for oil compared to 2017, oil production cuts by OPEC and other large oil producing countries such as Russia, and higher crude oil costs. Crude oil is about $18 per barrel more than a year ago. Crude oil costs account for 57 percent of the cost of a gallon of gas, according to the U.S. Energy Information Administration. Every $1 change in the price of crude results in about a 2.4-cent change in the price of gasoline.
Oregon is one of 46 states and the District of Columbia where gas prices are higher week-over-week. Five states are experiencing double-digit increases: Utah (+15 cents), Idaho (+14 cents), New Mexico (+12 cents), Delaware (+12 cents) and South Carolina (+11 cents). Oregon’s weekly increase is the 10th largest in the country at nine cents. The only states with decreases for the week are Ohio, Hawaii, Montana and North Dakota and all of these declines are just one cent or less.
Oregon is one of 48 states and the District of Columbia where prices are higher now than a month ago. The national average is 10 cents more and the Oregon average is 14 cents more than a month ago. This is the third-largest monthly increase in the country. The largest is in Michigan (+21 cents). The largest monthly decrease is in North Dakota (-2 cents).
The West Coast still has the most expensive gas prices in the nation with six of the top ten states in this region. Hawaii tops the list, followed by California, Alaska, Washington, Oregon and Nevada. Oregon is fifth most expensive for the eighth week in a row. All West Coast states saw pump prices rise this week, except for Hawaii’s average which fell fractions of a cent.
According to the U.S. Energy Information Administration’s (EIA) latest weekly report, total gasoline stocks in the region increased last week by 400,000 bbl. They now sit at 32.8 million bbl, which is approximately 4.2 million bbl more than last year’s level at this time.
The nation’s cheapest markets are Missouri ($2.32) and Mississippi ($2.37). For the 34th week in a row, no states have an average below $2.
Drivers in all 50 states and the District of Columbia are paying are paying more than a year ago to fill up. The national average is 34 cents more and the Oregon average is 39 cents more than a year ago. This is the fifth-largest yearly increase in the country. Hawaii has the greatest year-over-year increase of 44 cents; California is second at 50 cents, Washington is third at 31 cents, and Alaska is fourth at 29 cents.
Oil Market Dynamics
Crude oil prices rallied last week after EIA’s report revealed crude inventories fell for the third consecutive week. Crude oil inventories dropped 2.6 million barrels from the previous week, and storage levels across the country now total 428.3 million barrels. When compared to last March, current domestic crude inventories are 104.8 million barrels lower. This year-over-year change could be attributed to higher than usual gasoline demand in the U.S. for this time of the year, which has also coincided with growing crude and gasoline exports from the U.S.
The lowering crude data also signaled that OPEC’s production reduction agreement with other large producers, including Russia, is helping to drain global crude supplies and lift the price per barrel. The reduction agreement will be in effect through the end of 2018, and it may extend into 2019. Last week in an interview, Saudi Arabia’s Energy Minister Khalid al-Falih said that OPEC would need to continue coordinating with non-OPEC countries in the agreement on what measures to take to curb global crude supplies in 2019. This news contributed to the WTI rally that occurred at the end of last week. The supply reduction agreement, which has been in place since January 2017, has helped participating countries remove 1.8 million b/d from global crude supplies. While the agreement has been in place there has been a reduction in the global supply in crude — which has also helped to lift the price. An extension of the current agreement will likely push prices up and supplies down further.
Meanwhile, U.S. crude production continues to boom. According to EIA’s data last week, production in the U.S. hit another record high of 10.41 million b/d. As another sign of expanded crude production growth in the U.S., Baker Hughes reported that the U.S. gained four active oil rigs last week, bringing the total to 804. The total is 152 more rigs than last year at this time.
At the close of Friday’s formal trading session on the NYMEX, WTI increased $1.58 to settle at $65.88. At the close of Monday’s formal trading session on the NYMEX, WTI lost $0.33 to settle at $65.55. Today crude is trading around $65, compared to $63 a week ago. Crude prices are up about two percent in the last month and are about $18 more per barrel than a year ago.
Drivers can find current gas prices along their route with the free AAA Mobile app for iPhone, iPad and Android. The app can also be used to map a route, find discounts, book a hotel and access AAA roadside assistance. Learn more at AAA.com/mobile.
Diesel
For the week, the national average adds three cents to $2.95 a gallon. Oregon’s average jumps a nickel to $3.13. A year ago the national average for diesel was $2.50 and the Oregon average was $2.66.
Find current fuel prices at GasPrices.AAA.com.
AAA news releases, high resolution images, broadcast-quality video, fact sheets and podcasts are available on the AAA NewsRoom at NewsRoom.AAA.com.