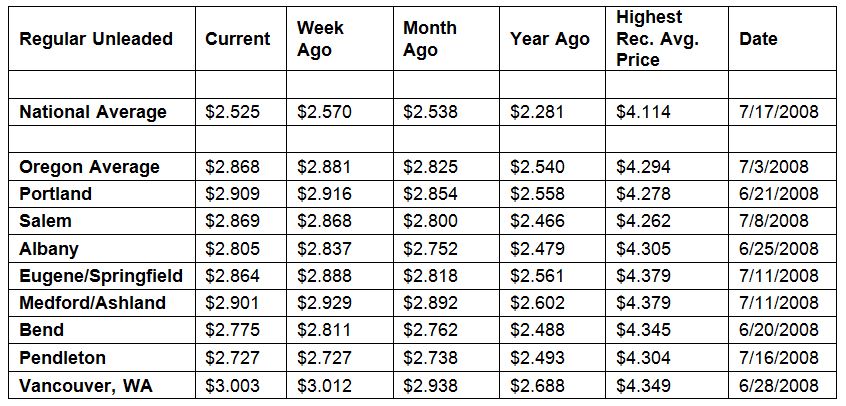
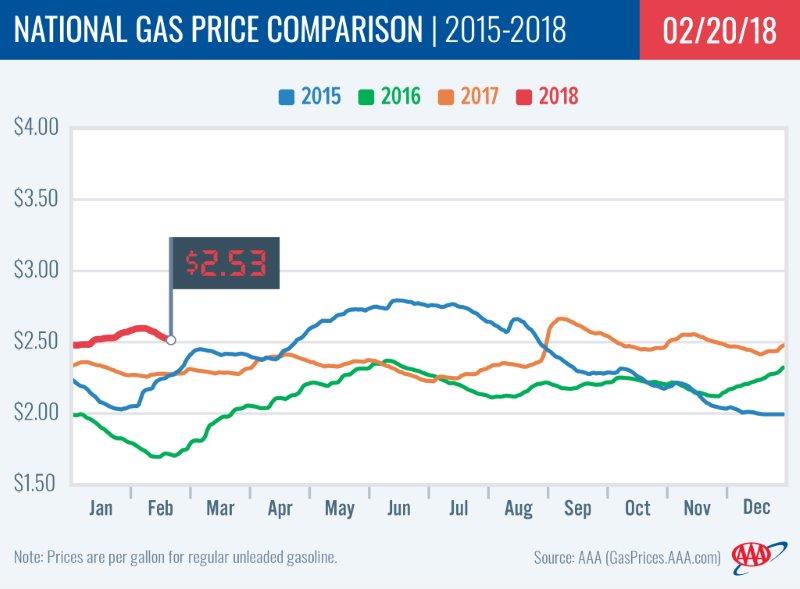
PORTLAND, Ore., – Retail pump prices have been steadily decreasing for a couple of weeks due in part to lower crude oil prices. For the week, the national average for regular unleaded loses four cents to $2.53 a gallon while the Oregon average slips one-and-a-half cents to $2.87. Both averages have fallen from their year to date highs. The national average peaked for the year so far at $2.61 on Feb. 5, while the Oregon average peaked at $2.90 on Feb. 7 through 9.
“The big question is how long will prices decline. This is the time of year when refinery maintenance begins, ahead of the switchover to summer-blend fuel, and that always puts upward pressure on retail pump prices,” says Marie Dodds, public affairs director for AAA Oregon/Idaho. “If refineries remain off line and production slows at a high rate and/or if crude oil prices jump, pump prices could shoot up.”
Oregon is one of 48 states and the District of Columbia where gas prices are lower week-over-week. The largest decreases are in Michigan (-11 cents) and Florida (-8 cents). The only two states where prices increased are Hawaii (+2 cents) and Indiana (+1 cent).
Oregon is one of 24 states where prices are higher now than a month ago. The national average is one cent more and the Oregon average is four cents more than a month ago. The largest monthly increases are in California (+14 cents) and Hawaii (+11 cents). The largest monthly decrease is in Michigan (-19 cents).
The West Coast still has the most expensive gas prices in the nation with six of the top ten states in this region. Hawaii tops the list, followed by California, Alaska. These states are the only three with averages at or above $3 a gallon. Washington is fourth. Oregon is fifth most expensive for the third week in a row.
| Rank | Region | Price on 2/20/18 | |
| 1 | Hawaii | $3.47 | |
| 2 | California | $3.33 | |
| 3 | Alaska | $3.03 | |
| 4 | Washington | $2.99 | |
| 5 | Oregon | $2.87 | |
| 6 | Pennsylvania | $2.83 | |
| 7 | Nevada | $2.79 | |
| 8 | District of Columbia | $2.75 | |
| 9 | New York | $2.73 | |
| 10 | Connecticut | $2.71 |
According to the U.S. Energy Information Administration (EIA), gasoline stocks in this region fell slightly by 600,000 bbl. Inventories still sit at a comfortable 34.4 million bbl, which is 3.3 million bbl higher than they were at this time last year.
The nation’s cheapest markets are Texas ($2.27) and Mississippi ($2.27). For the 30th week in a row, no states have an average below $2.
Drivers in all 50 states and the District of Columbia are paying are paying more than a year ago to fill up. The national average is 24 cents more and the Oregon average is 33 cents more than a year ago. This is the third-largest yearly increase in the country. California has the greatest year-over-year increase of 43 cents; Hawaii is second at 35 cents.
Oil Market Dynamics
Crude oil prices are back above $60 per barrel, after sliding below that mark two weeks ago for the first time in 2018. Market watchers will closely monitor to see how much a surge in U.S. production eats into OPEC’s efforts to rebalance the market to determine the impact it has on crude oil prices.
The latest EIA petroleum report last week revealed that U.S. oil production grew 332,000 b/d, putting total crude output at 10.271 million b/d. Likewise, U.S. crude inventories rose for a third straight week by 1.8 million bbl. Inventory levels now total 422.1 million bbl. Moreover, according to Baker Hughes, the U.S. added 7 oil rigs last week bringing the total rig count to 798.
Increased U.S. production coupled with the fourth consecutive week of increases in the U.S. oil rig count has placed a spotlight on OPEC’s restrained production agreement aimed at rebalancing the global oil supply.
At the close of Friday’s formal trading session on the NYMEX, WTI increased 34 cents to settle at $61.68. Markets were closed yesterday in observance of President’s Day. Today crude is trading around $62, compared to $59 a week ago. Crude prices are down about two percent in the last month and are about $8 more per barrel than a year ago.
Drivers can find current gas prices along their route with the free AAA Mobile app for iPhone, iPad and Android. The app can also be used to map a route, find discounts, book a hotel and access AAA roadside assistance. Learn more at AAA.com/mobile.
Diesel
For the week, the national average slips two-and-a-half cents to $2.96 a gallon. Oregon’s average dips one-and-a-half cents to $3.07. A year ago the national average for diesel was $2.52 and the Oregon average was $2.67.
Find current fuel prices at GasPrices.AAA.com.
AAA news releases, high resolution images, broadcast-quality video, fact sheets and podcasts are available on the AAA NewsRoom at NewsRoom.AAA.com.