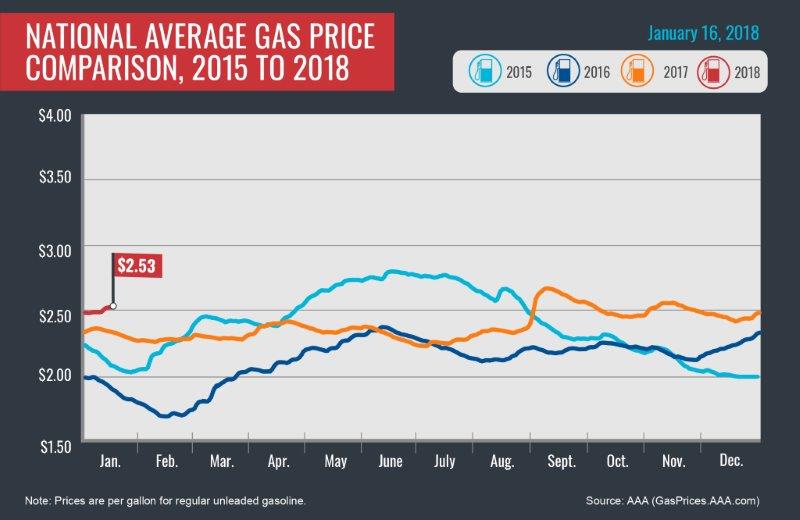
PORTLAND, Ore., – Robust demand for gasoline and rising crude oil prices are putting upward pressure on pump prices. For the week, the national average for regular unleaded jumps four cents to $2.53 a gallon while the Oregon average adds up one-and-a-half cents to $2.82.
According to the U.S. Energy Information Administration (EIA), gasoline demand increased 164,000 bbl on the week to register at 8.8 million. This is the highest demand for the first EIA report of January since 2011 and is a contributing factor to this week’s higher pump prices.
“So far demand for gasoline this January is higher than any week in January of last year,” says Marie Dodds, public affairs director for AAA Oregon/Idaho. “If demand remains strong, drivers are likely to see pump prices continue to climb.”
Oregon is one of 47 states and the District of Columbia where gas prices are higher week-over-week. The largest increases are in Kansas, Kentucky, Indiana and Iowa where gas prices are nine cents more than a week ago. Alaska (-2 cents) and Rhode Island (-1/2 cent) are the only two states to see prices fall, while Hawaii’s average is the same as a week ago.
Oregon is one of 42 states and the District of Columbia where gas prices are higher now than a month ago. The national average is nine cents more and the Oregon average is two cents more than a month ago. The largest monthly increase is in Michigan (+23 cents). The largest monthly decrease is in Alaska (-11 cents).
The West Coast still has the most expensive gas prices in the nation with six of the top ten markets in this region. Hawaii has the most expensive gasoline in the country, followed by California and Alaska. These states remain the only three with averages at or above $3 a gallon. Washington is fourth. Oregon is fifth most expensive for the 29th week in a row.
| Rank | Region | Price on 1/16/18 |
| 1 | Hawaii | $3.30 |
| 2 | California | $3.18 |
| 3 | Alaska | $3.08 |
| 4 | Washington | $2.93 |
| 5 | Oregon | $2.82 |
| 6 | Pennsylvania | $2.80 |
| 7 | District of Columbia | $2.75 |
| 8 | Michigan | $2.69 |
| 9 | Nevada | $2.68 |
| 10 | New York | $2.68 |
The EIA’s first weekly petroleum status report for 2018 found that gasoline inventories on the West Coast measure near a 2-year high at 33.4 million bbl. The level is well above the 28 million bbl threshold that many market observers consider “comfortable” for the region. Additionally, the region’s refineries produced 1.48 million b/d of gasoline according to the EIA’s latest report. This is why gas prices in this region haven’t increased as much in the last week as in other parts of the country. However, as winter and planned maintenance ahead of spring moves forward, gasoline production levels may decline in the coming weeks.
The nation’s cheapest markets are Texas ($2.28) and Alabama ($2.28). For the 25th week in a row, no states have an average below $2.
Drivers are paying more than a year ago to fill up. The national average is 19 cents more and the Oregon average is 26 cents more than a year ago. This is the sixth-largest yearly increase in the country. Indiana has the greatest year-over-year increase of 42 cents; California is second at 37 cents, Michigan is third at 30 cents, Alaska is fourth at 30 cents and Montana is fifth at 28 cents.
Oil Market Dynamics
Crude oil prices started the year above $60 per barrel and that’s where they remain. Oil prices edged higher last week following the release of EIA’s report for the first week of 2018, which revealed that domestic crude oil production dropped by 290,000 b/d. The decline is the largest U.S. production drop since the highly active hurricane season ended in mid-October last year. Moreover, crude inventories around the country dropped by 4.9-million bbl.
Some market observers believe oil prices will continue to climb as production slows and inventories grow tighter. However, the drop in production may be short-lived. Baker Hughes, Inc. reported that last week, the number of active oil rigs in the U.S. grew by 10, bringing the total number of rigs to 752. The oil produced by these rigs may help the U.S. reach a new crude production level of 10 million b/d later this year, as speculated by many market observers.
At the close of Friday’s formal trading session on the NYMEX, WTI increased 50 cents to settle at $64.30. Markets were closed yesterday in observance of Martin Luther King Jr. Day. Today crude is trading around $64, compared to $63 a week ago. Crude prices are up about 11 percent in the last month and are about $11 more per barrel than a year ago.
Drivers can find current gas prices along their route with the free AAA Mobile app for iPhone, iPad and Android. The app can also be used to map a route, find discounts, book a hotel and access AAA roadside assistance. Learn more at AAA.com/mobile.
Diesel
For the week, the national average gains two cents to $2.93 a gallon. Oregon’s average adds a penny to $3.05. A year ago the national average for diesel was $2.53 and the Oregon average was $2.68.
Find current fuel prices at GasPrices.AAA.com.
AAA news releases, high resolution images, broadcast-quality video, fact sheets and podcasts are available on the AAA NewsRoom at NewsRoom.AAA.com.